
There are many teams that can win the upcoming football world cup in Qatar and nobody can at this point know which of them will win. The best one can do is to provide probabilistic predictions. I will here explain how one can check the correctness of probabilistic predictions and will use this to argue that, quite possibly, the best predictions are those that one can derive from the sports betting market. My argument is based on using a large data set of betting odds to test the so-called efficient market hypothesis.
The outcome of one game (or one world cup) is not enough to test the predictive power of probabilistic predictions. Suppose you predict that, say, France beats Australia with probability 2/3 and I predict that France wins with probability 1/3. Suppose Australia wins. Was I correct and were you wrong?
It is essentially impossible to meaningfully test a single probabilistic prediction (unless you predict probabilities of, or very close to, zero or one), but you can test a (large) set of predictions. Betting markets provide such a set of predictions in terms of the betting odds that arise from people betting on the various outcomes of games.
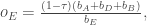
Betting odds are the equivalent of prices in stock markets. They are also determined by supply and demand. But because they are a bit different from prices, I should probably briefly explain how they are typically determined by the betting companies. A football game between teams A and B can end in three key outcomes: team A wins, a draw, or team B wins. You can bet on any of these three events. In fact, you can bet on a lot more, but I will not pursue this here. When you are betting you are typically given odds. If the odds are 


where 
If the odds that team A wins are 


Let us now turn to the statistical analysis of these betting odds. I am using betting odds data for more than 200.000 professional football games from most of the major leagues in the world between 2006 and 2019 (downloaded from pinnacle.com in April 2019). I have chosen to focus on home team wins.
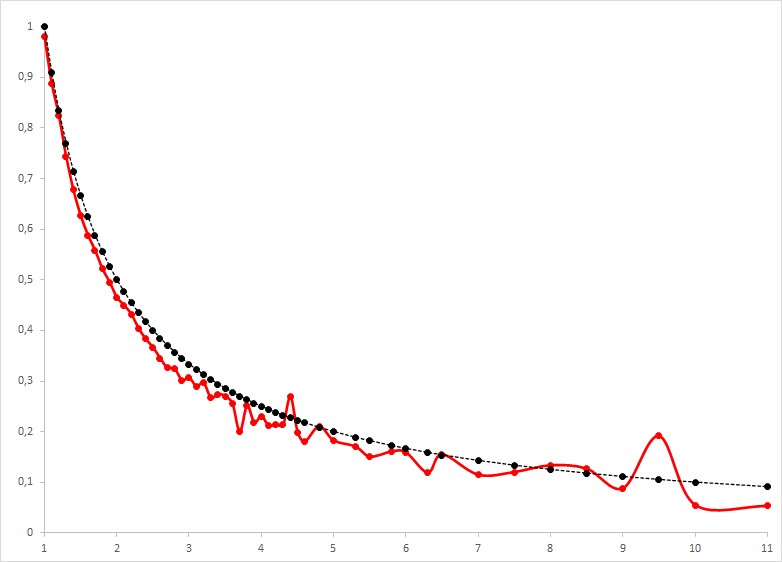
In the above figure I compare the actual observed win frequencies (fat line in red) with the implicit probabilities (dashed line in black) for all odds between 1 and 11 (on the x-axis). Isn’t it remarkable how close these two curves are? Look, for instance, at these two points: Of the 3138 games with betting odds of 1.2 with implied break-even probability of about 83%, the observed winning frequency is 82.3%. Of the 11045 games with betting odds of 2.2 and implied break-even probability of 45.5%, the observed win frequency is 43.2%. Note that the two curves come from entirely different data. The implicit probabilities are derived from the betting odds, which in turn, as I explained above, are derived exclusively from the betting behavior in the betting market. The observed win frequencies are derived from counting how often teams win their football games. Two entirely different things. And yet, they match almost perfectly. One could say that the implicit probabilities derived from the betting odds are really well calibrated: they are great estimates of the actual winning probabilities of, in this case, the home teams in football games.
This idea is, in fact, an implication of the so-called efficient market hypothesis: the hypothesis that market-prices aggregate all information that people may have, and, thus, deliver the best estimates for the underlying probabilities.
There are a few caveats to what I just wrote. Looking at the above figure we note that it is in fact true that almost all actual winning frequencies are below the implicit break-even probabilities. This derives from the fact that the betting company keeps its 
But what about the few odds for which the implicit probability is above the observed win frequency? This happens for 6 out of 53 odds. It happens for odds of 4.4, 4.8, 6.5, 8, 8.5, and 9.5. Does this mean that we should bet on games with these particular odds in the future and, doing so, will make money on average? Does this contradict the efficient market hypothesis?
I don’t think so. With 2292 games in total there are not that many games with these betting odds in the data set. For the two betting odds of 4.4 and 9.5, for which the observed winning frequency is more clearly above the implied break-even probability, there are only 26 and 94 games. Even if the true winning probabilities are less than or equal to the implied break-even probabilities, one can relatively easily get higher observed win frequencies for at least some betting odds purely by chance. For the statisticians among you, one cannot reject the null hypothesis that all true win probabilities for all betting odds are less than or equal to the respective implied break-even probabilities with the given data (p-value of 0.189). Let me know if you want to know what statistical test I used.
So, we cannot reject the null hypothesis, implied by the efficient market hypothesis, that the betting odds are well calibrated. Does this mean that one couldn’t potentially produce better probabilistic predictions? Does this mean that the efficient market hypothesis is true? No. This is only one possible test of the efficient market hypothesis, which not only states that implicit probabilities should be well calibrated, but also that they include all the information that is available about the games out there in the world. There is a sense that we know that this is not true. Occasionally, there are games that are rigged. This means that there are some people who know how these games will end, and this information is often not reflected in the betting odds. But, on the whole, and this is still a bit of a leap of faith, I believe that it is hard to come up with more accurate probabilistic predictions of how football games end than those derived from the betting market.
Who will then win the World Cup? According to the betting odds of the 9th of November (from oddschecker.com), Brazil is the favorite with a win probability of 23.8% (betting odds 4.2). This is followed by Argentina with 16.1% (betting odds 6.2), France with 14.3% (betting odds 7), England with 11.4% (betting odds 8.8), Spain with 11.1% (betting odds 9) and Germany with 8.3% (betting odds 12). Saudi Arabia and Costa Rica have the lowest chances of winning with 0.1% each (betting odds 1000). However, these probability predictions can change at any time if there is relevant new information. For example, if Messi were to get injured, that would immediately change all betting odds and therefore all probability predictions. The betting market processes this information incredibly fast.

[…] Continue reading. […]
LikeLike
[…] determined by supply and demand, just like stock prices, as I explain in more detail in this previous blog post. I thought I would here, however, translate these odds into something more akin to a stock value. […]
LikeLike