
This short note makes one simple point. If you are interested in estimating the proportion of Corona infected people in some country or region, there is a simple and better (more precise) estimate than the one you obtain by computing the sample proportion. You can also read this in German here (and here).
Setup
Consider taking a (completely) random sample of 


When we take the random sample, we collect two pieces of information from each person. One, we check (again, for the sake of simplicity, with a perfect medical test) whether or not they have the virus. Two, we ask them (and the subject answers truthfully) whether they have already been declared as having the virus. I will call 

Estimator
Many people would probably be tempted to use 


In the Appendix below I derive (in a few simple steps) this estimator as an approximation of the maximum-likelihood estimator for the present problem. It, therefore, does have all the nice properties that maximum likelihood estimators have. But even if you are a maximum likelihood skeptic, we can actually just directly compare the precision (for all sample sizes) of the two estimators, by looking at their variances.
First note that, like the standard estimator, the alternative estimator is unbiased as
![\mathbb{E}\left[\hat{\mu}_A\right]=1+\frac{\mu qn - qn}{qn} = \mu.](https://s0.wp.com/latex.php?latex=+%5Cmathbb%7BE%7D%5Cleft%5B%5Chat%7B%5Cmu%7D_A%5Cright%5D%3D1%2B%5Cfrac%7B%5Cmu+qn+-+qn%7D%7Bqn%7D+%3D+%5Cmu.+&bg=ffffff&fg=3a3a3a&s=0&c=20201002)
The variance of the two estimators are
and, as 
where the approximation is good when
![\mathbb{V}\left[\hat{\mu}_S\right] = \frac{\mu(1-\mu q)}{qn} \approx \frac{\mu}{qn},](https://s0.wp.com/latex.php?latex=+%5Cmathbb%7BV%7D%5Cleft%5B%5Chat%7B%5Cmu%7D_S%5Cright%5D+%3D+%5Cfrac%7B%5Cmu%281-%5Cmu+q%29%7D%7Bqn%7D+%5Capprox+%5Cfrac%7B%5Cmu%7D%7Bqn%7D%2C+&bg=ffffff&fg=3a3a3a&s=0&c=20201002)

![\mathbb{V}\left[\hat{\mu}_A\right] = \frac{(\mu-1)(1-q(\mu-1))}{qn} \approx \frac{\mu-1}{qn},](https://s0.wp.com/latex.php?latex=+%5Cmathbb%7BV%7D%5Cleft%5B%5Chat%7B%5Cmu%7D_A%5Cright%5D+%3D+%5Cfrac%7B%28%5Cmu-1%29%281-q%28%5Cmu-1%29%29%7D%7Bqn%7D+%5Capprox+%5Cfrac%7B%5Cmu-1%7D%7Bqn%7D%2C+&bg=ffffff&fg=3a3a3a&s=0&c=20201002)
In this case the ratio of the two variances is given by
![\frac{\mathbb{V}\left[\hat{\mu}_A\right]}{\mathbb{V}\left[\hat{\mu}_S\right]} = \frac{\mu-1}{\mu} < 1.](https://s0.wp.com/latex.php?latex=+%5Cfrac%7B%5Cmathbb%7BV%7D%5Cleft%5B%5Chat%7B%5Cmu%7D_A%5Cright%5D%7D%7B%5Cmathbb%7BV%7D%5Cleft%5B%5Chat%7B%5Cmu%7D_S%5Cright%5D%7D+%3D+%5Cfrac%7B%5Cmu-1%7D%7B%5Cmu%7D+%3C+1.&bg=ffffff&fg=3a3a3a&s=0&c=20201002)
Thus, especially, if
Austrian Corona cases
In Austria, from 1st to 6th of April, a random sample of 


Using the, here also easily applicable, Clopper-Pearson method to compute 95\% confidence bounds, we get the following estimates and bounds derived from the two different estimators.

As you can see, the confidence bounds are much narrower for the alternative estimator than for the standard estimator.
A Thought
If we could assume, which sadly we often probably cannot, that the proportionality factor 

Then a random sample of people in Landeck would produce a much more precise estimate for 
Another Thought
Of course, there is nothing specific about the setup here that makes it only applicable to counting virus cases. This estimator could be used in all cases in which we are interested in the true proportion of some attribute A in some population, when we know that only A’s can also have attribute B and we know how many B’s there are. Looking at it like that I am sure this estimator is known. So I am here just reminding you all about it.
Appendix
We here derive the alternative estimator as an approximation to the maximum likelihood estimator. Taking a truly random sample, we know that 


The log-likelihood function is then proportional to

The maximum likelihood estimator, thus, has to satisfy
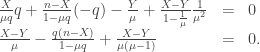
If 

If 


